How to Read Candlestick Charts: A Step-by-Step Guide for Position Holding
November 29, 2024

Step-by-Step: Mastering Candlestick Charts for Better Position Holding
If you’re using candlestick charts to support position holding strategies, learning how to read them step-by-step is essential. This guide will take you through everything from understanding individual candles to spotting patterns and interpreting market sentiment.

Step 1: Know What a Candlestick Tells You
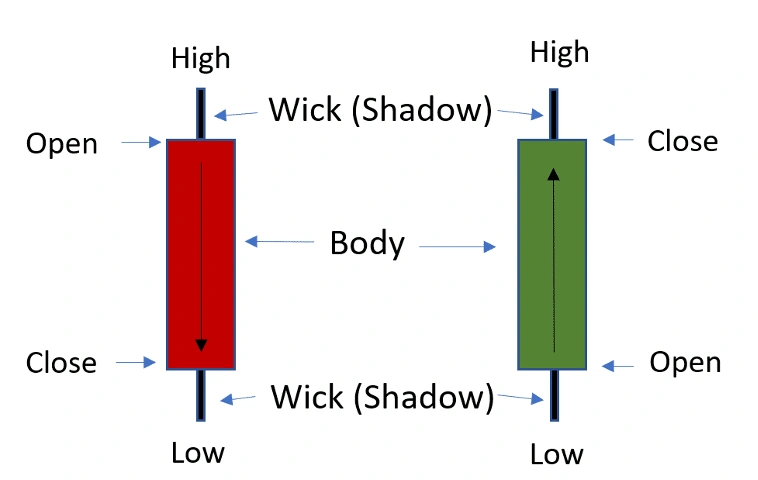
Each candlestick shows four data points—open, close, high, and low—for a specific time frame. These data points form the candle’s body and wicks. A green candle means the closing price was higher than the opening price (bullish), while a red one means the opposite (bearish).
Understanding this structure is the foundation of chart reading.
Step 2: Identify the Time Frame That Matches Your Position Holding Goals
The time frame of the chart should match your holding strategy. Long-term holders may prefer daily or weekly candles, while short-term traders might use 15-minute or hourly charts.
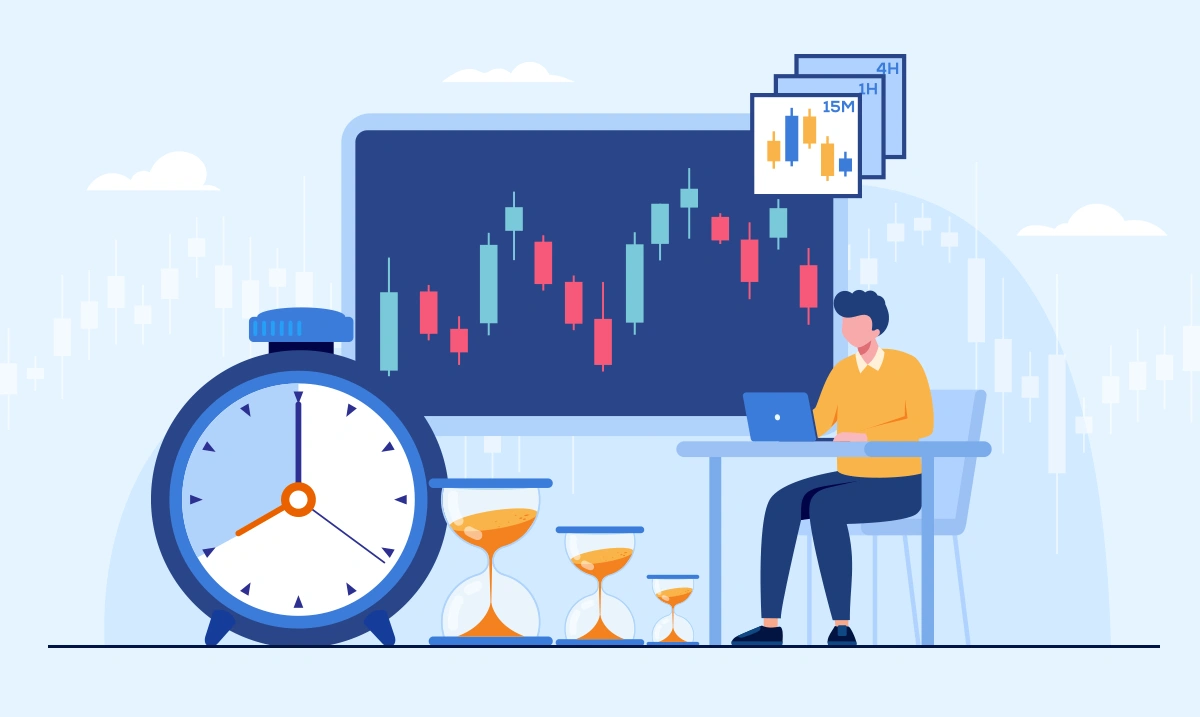
Matching time frame to strategy ensures your signals are relevant.
Step 3: Spot Reversal Patterns Early
Patterns like the hammer, doji, or bullish/bearish engulfing can indicate trend reversals. A hammer after a downtrend may suggest a shift toward buying pressure. But these patterns only matter if confirmed by subsequent candles.
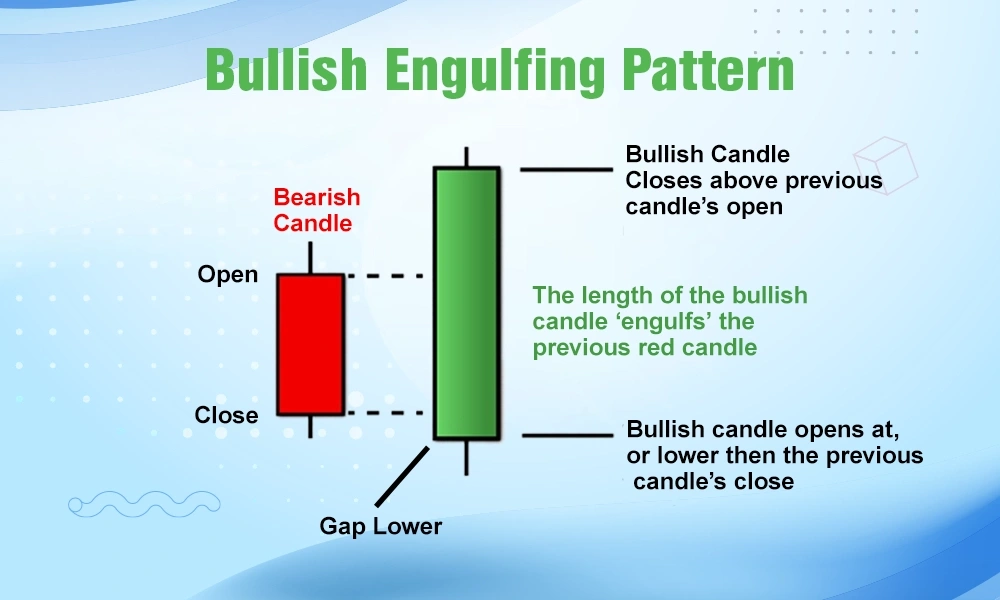
One candle alone isn’t enough to act—confirmation is key.
Step 4: Use Candlestick Groupings to Confirm Trends
A single candlestick tells a brief story, but clusters of candles reveal the bigger picture. Look for a sequence of higher highs and higher lows to confirm an uptrend, or lower highs and lower lows for a downtrend.
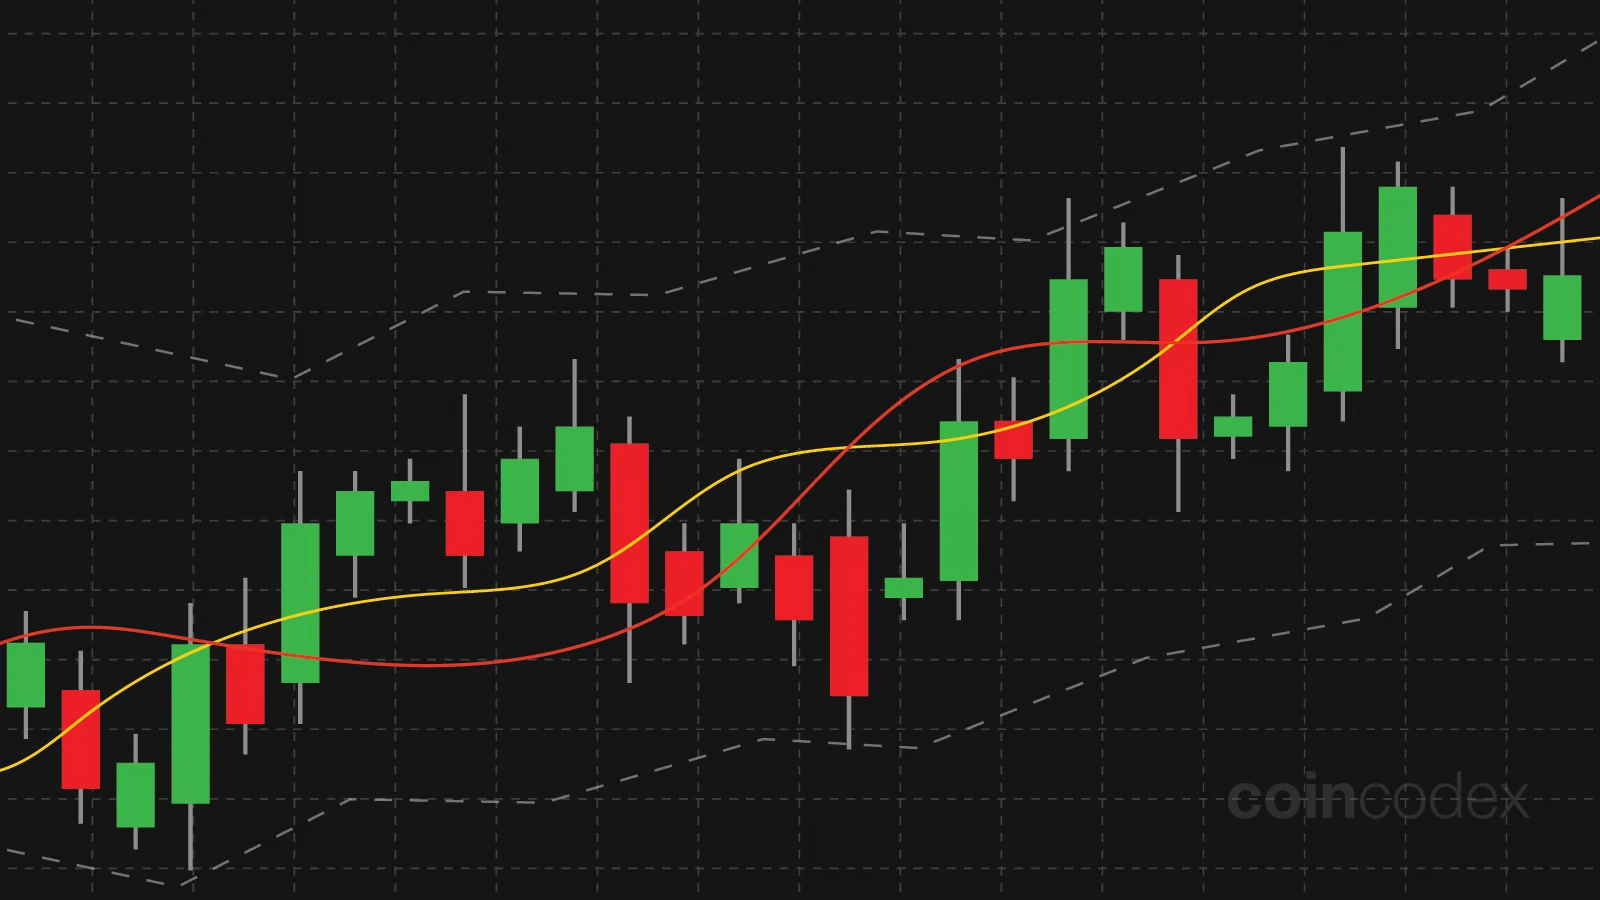
Trend recognition comes from zooming out, not overreacting to one signal.
Step 5: Factor in Volume and Position Holding Context
Candlestick analysis works best when paired with volume and your holding strategy. A bullish pattern backed by high volume is more trustworthy than one with low volume. Position holders should ask: Does this pattern align with broader support or resistance levels?

Volume validates what candlestick patterns suggest.
Step 6: Read Candlestick charts for Market Sentiment
Candlestick shapes often reflect trader emotions like fear, greed, and hesitation. Long wicks can show indecision. For example, a small-bodied candle with long wicks may indicate a tug-of-war between buyers and sellers.
Psychological patterns matter—especially when you’re holding through volatile periods.
Step 7: Combine Candlestick Analysis With External Factors
Don’t use candlestick charts in isolation. News events, economic reports, and earnings can change everything. A solid pattern can fail quickly if external sentiment shifts.
Use charts as a signal, not a certainty.
Final Thoughts about Candlestick charts
Reading candlestick charts is a repeatable process that gets easier over time. As you gain experience, you’ll develop an instinct for which patterns matter and which to ignore. When applied correctly, they support smarter position holding and better timing for entry and exit.
Start simple, stay consistent, and always seek confirmation before acting.
Relevant news: here