XRP Plummets as Bitcoin Surpasses $100,000
May 28, 2025


XRP’s Price Drops Amid Bitcoin’s All-Time High
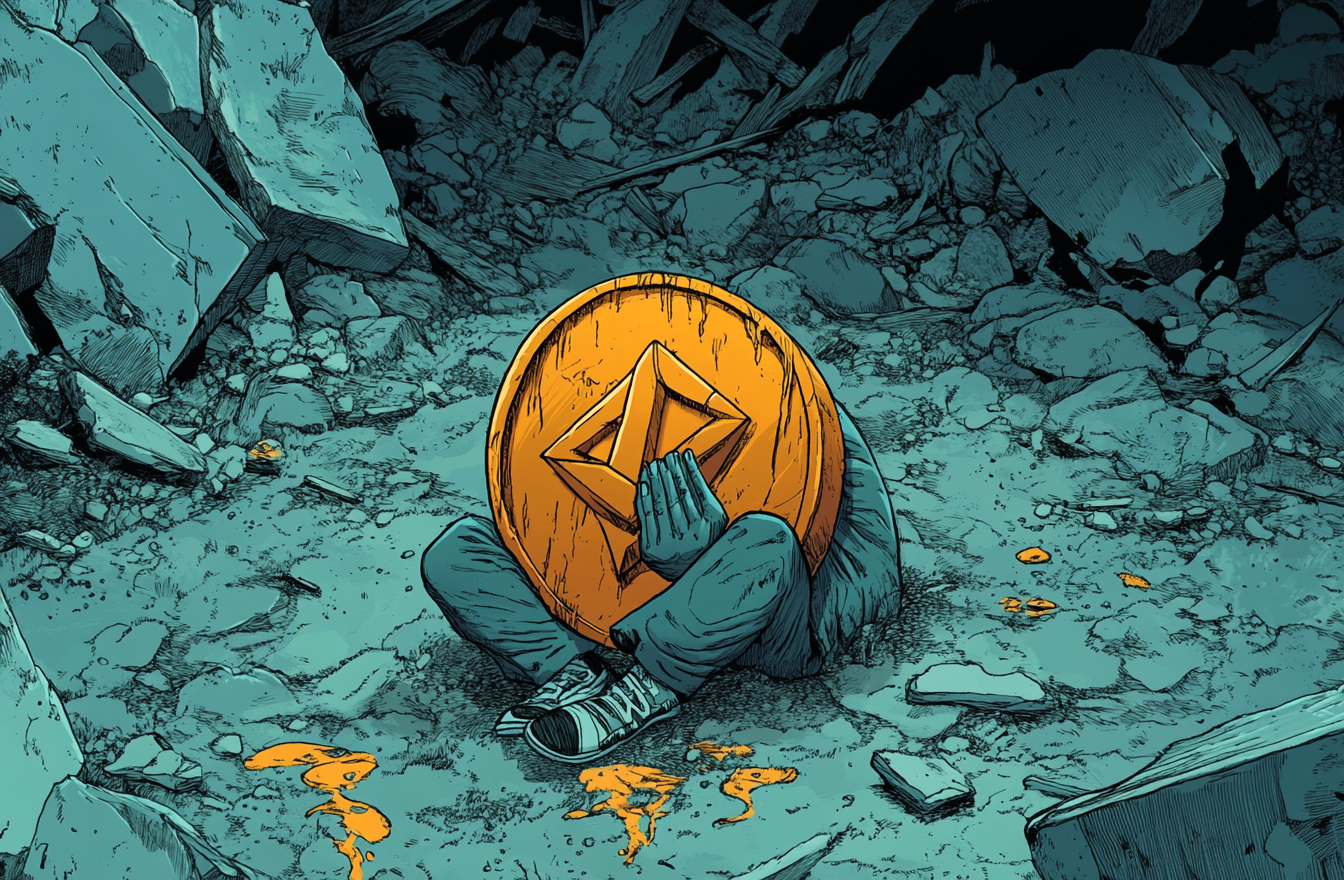
XRP experienced a 13% drop on December 5, falling to $2.30, as Bitcoin reached a new all-time high of $103,000. This follows a sharp correction from XRP’s December 3 peak of $2.90, resulting in a 25% loss in just two days. XRP’s market cap also dropped by 8%, and it was overtaken by Tether (USDt) in market rankings.
Reversal of XRP’s Outperformance of Bitcoin
XRP had significantly outperformed Bitcoin between November 1 and December 3, with a remarkable 354% rally compared to BTC’s 45.5% rise. However, this trend reversed as Bitcoin surpassed $100,000, leading to a decline in XRP’s BTC ratio to 0.00002334 by December 5. The reversal has been linked to a shift in investor focus toward Bitcoin.
Impact of Liquidations on XRP’s Decline
The price drop was exacerbated by liquidations totaling $12.8 million in long XRP positions. Furthermore, XRP’s open interest (OI) fell to $4.3 billion, a notable decrease from the $722 million in November. This drop in OI suggests a more cautious outlook among traders as market volatility rises.
Bullish Technical Pattern Offers Hope for Rebound
Despite the price drop, XRP’s technical indicators show signs of potential recovery. A bull flag pattern has appeared on the four-hour chart, which could signal a continuation of the uptrend. If XRP breaks the $2.37 level, it could target $4.83, marking a new all-time high and offering a potential rebound.
Support Levels to Monitor for Potential Reversal
XRP’s RSI has decreased from 82 to 52, signaling reduced momentum. If XRP fails to maintain support at $2.37, further drops to $2.05 or $1.68 may occur. These critical support levels will play a key role in determining whether XRP can recover or if the bearish trend will continue.

